April 21, 2026
9 min read
Federal Reserve data shows a 19.3% revenue swing between January and July for restaurants. The operators who thrive year-round see the transition coming in their booking data weeks before revenue drops.
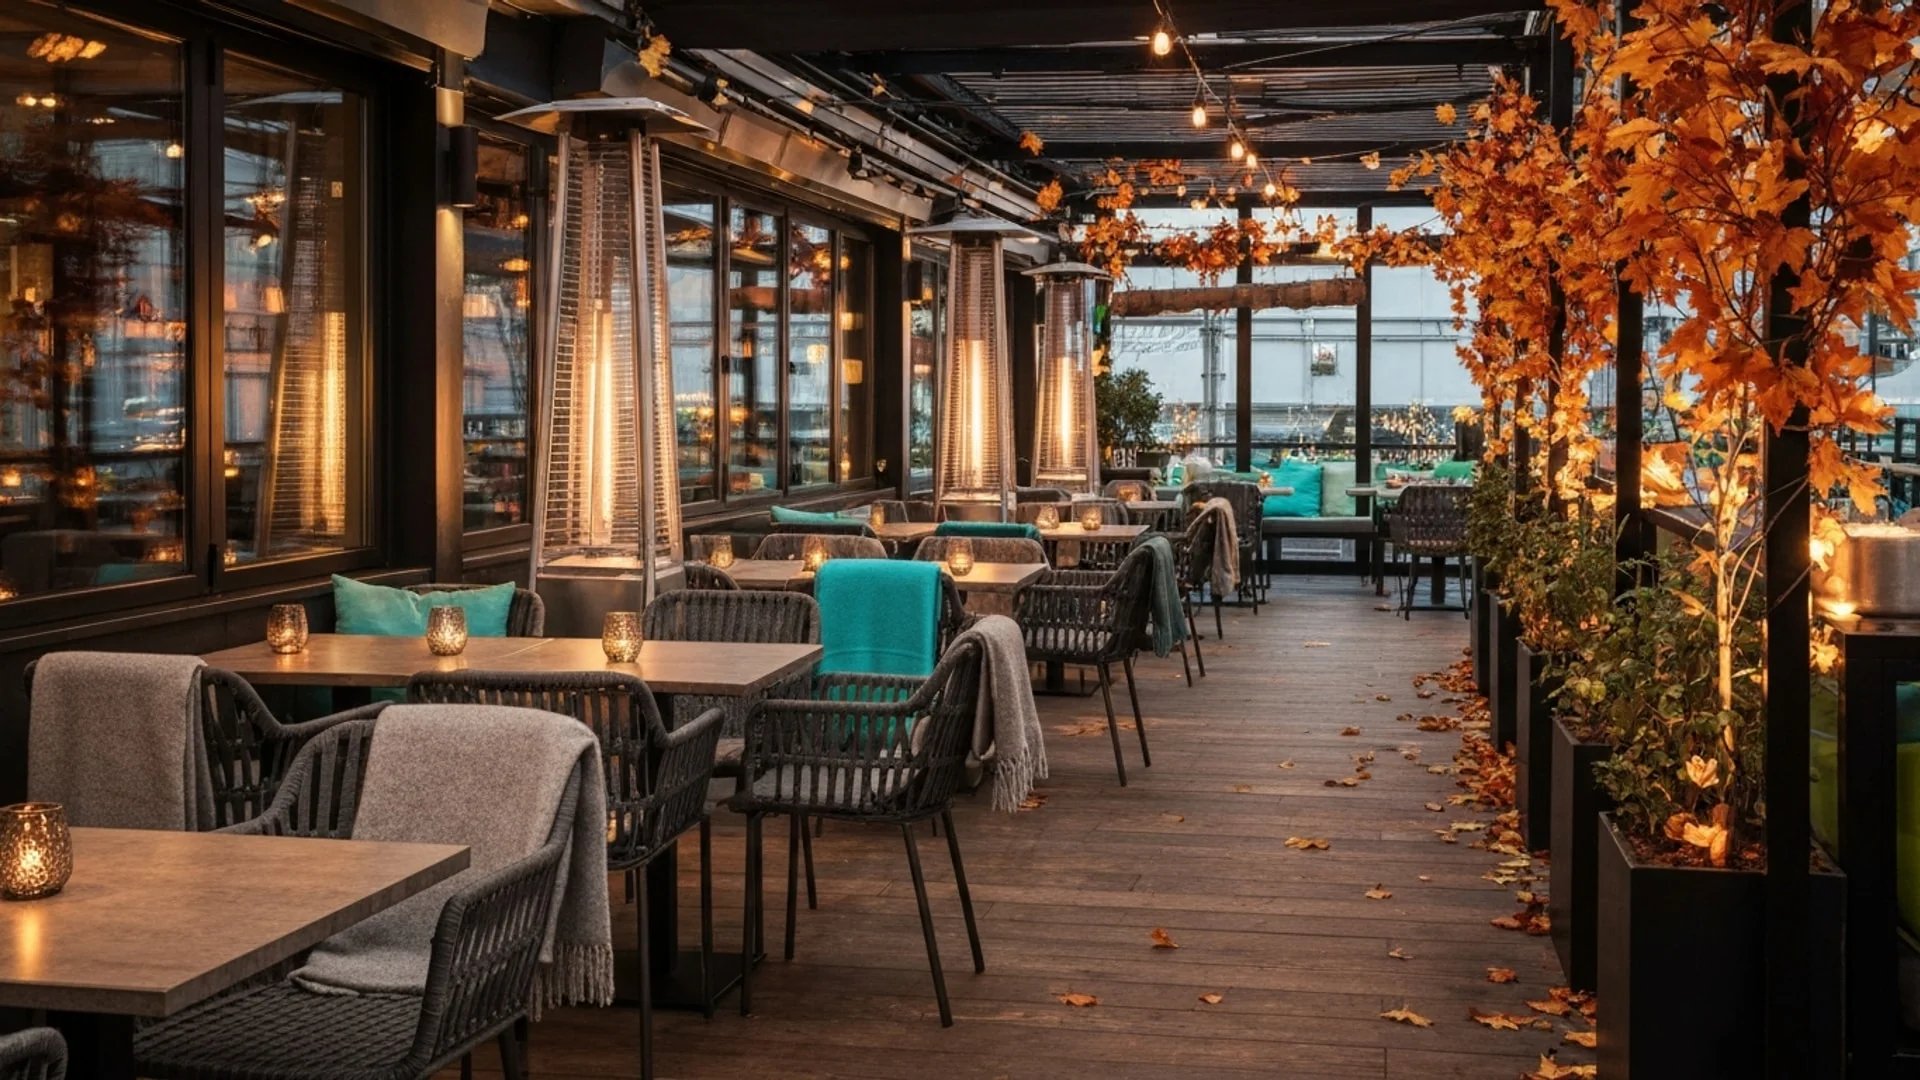
Eliza Gavin runs 221 South Oak in a mountain resort town. Her cover count swings 57% between peak season and off-season. That is not a slow week -- it is the structural reality of operating a restaurant where demand follows a calendar you did not write.
Every restaurant has a version of this. Maybe not 57%. Maybe 15%. But the swing exists, and Federal Reserve data confirms the pattern at industry scale: there is a 19.3% gap between January lows and July peaks in US restaurant revenue.
The restaurants that survive this swing are not the ones with the best food or the best location. They are the ones that see the transition coming -- in their booking data, in their cover trends, in the patterns that show up weeks before revenue drops. And they act early enough for the response to matter.
Toast platform data adds texture to the Federal Reserve numbers: January traffic runs 11% below June peak, with a 3% drop in per-transaction spending on top of the volume decline.
On a casual dining restaurant with $80,000 in monthly revenue during peak season, an 11% traffic drop plus a 3% spend decline produces roughly $11,000 in lost monthly revenue. At a 5% net margin, that restaurant's peak-month profit was $4,000. The off-season revenue decline alone wipes it out -- before you account for the fixed costs that do not flex downward.
Rent does not negotiate with January. The NRA reports that occupancy costs exceed 5% of sales for most restaurants -- a fixed line item that compresses margins exactly when revenue drops.
Full-service restaurant labour costs run at a median of 36.5% of sales. In seasonal markets, that percentage can swing from 25% during peak to 40% in the quiet months -- not because you are paying more people, but because the same core team is serving fewer guests.
This is where the planning gap sits. Most operators feel the slow season when revenue dips. The data-driven ones see it coming two to three weeks earlier in booking velocity, walk-in patterns, and average party size trends.
Here is the thesis, and it is worth testing against your own data: your slow season's booking patterns start shifting before your revenue does.
Cover count is a lagging indicator -- it tells you what happened. Booking velocity -- how far ahead guests are reserving, how many reservations you have today versus the same date last year, what percentage of your capacity is pre-booked versus walk-in -- is a leading indicator. It tells you what is about to happen.
Janos Wilder, a veteran operator in a desert city, sees a 30-50% drop in summer traffic. But the booking data shows the shift starting in the second week of May, two to three weeks before the revenue decline becomes visible in June numbers.
If you wait for the P&L to tell you summer is slow, you have already overstaffed three weeks of declining demand. If you watch booking pace, you can start adjusting staffing, ordering, and prep quantities while the revenue is still close to peak.
The same applies in reverse. When booking velocity picks up in late February for a spring peak, that is your signal to start hiring -- not in March when the dining room is already fuller than your team can handle.
Devony Boyle, HR director at Tom Douglas Seattle Kitchen (which manages 850-1,000 employees across multiple venues), starts peak-season recruitment in July for a fall readiness target. The hiring pipeline needs months, not weeks.
When every table is spoken for and the phone will not stop, the instinct is to celebrate. But high season has its own failure modes, and they are more expensive than you think.
No-show rates average 10-20% across the industry. 28% of Americans admit to having skipped a reservation in the past year.
On a fully booked Saturday at a 60-cover restaurant with a EUR 55 average check, a 15% no-show rate means 9 empty covers -- EUR 495 in lost revenue from a single service. Over a peak season of 16 weekends, that compounds to roughly EUR 15,840 in no-show losses alone. Add the food that was prepped and wasted, and the number grows.
The high-season playbook is not about getting more bookings. It is about getting more value from the bookings you have:
Tighten cancellation windows. Move from 24 hours to 48 hours during peak. Guests who cancel last-minute on a fully booked Saturday leave you with no recovery time.
Use deposits strategically. Not on every booking -- that adds friction that reduces volume. On large parties during peak nights, where a no-show has disproportionate impact. A table of 8 that no-shows on a Saturday represents 13% of a 60-cover restaurant's entire evening capacity.
Watch reservation durations. Different party sizes stay different lengths. A couple averages 70-80 minutes. A group of six averages closer to two hours. If your time slots assume uniform durations, you are either rushing large parties or leaving gaps after small ones.
Hold walk-in capacity. A 100% reserved restaurant sounds ideal, but it leaves no buffer for the no-shows you cannot prevent and the walk-ins you want to accommodate. Most operators find 80-85% reservation with 15-20% walk-in produces the best utilisation.
Empty tables in January hit differently than empty tables in July. The revenue decline is the visible symptom. The real risk is the fixed-cost squeeze -- rent, core staff, insurance, utilities -- that stays constant while income drops.
72,000 US restaurants closed in 2024. US Bank data shows that 82% of business failures stem from cash flow problems -- and seasonal revenue troughs are one of the most common triggers.
The operators who thrive in off-season do not just cut costs. They redefine what the restaurant offers.
Duke Moscrip of Duke's Restaurants maintains $14 million in annual revenue across locations despite 75% weather-driven demand variance. His approach includes a "Rain Check" program that incentivises visits during poor weather -- turning the worst demand days into loyalty-building moments.
Steve Pettus of Dickie Brennan's restaurants in New Orleans relies on a local dining frequency of 3.2 times per week to sustain off-season revenue. His team focuses on local loyalty rather than tourist marketing when the convention crowds thin out.
One documented loyalty experiment showed that offering double points during the 2-5 PM window on weekdays increased afternoon covers by 35% while maintaining the same average check.
The off-season is also when your regulars reveal themselves. The locals who come regardless of weather or tourist season are your base. Low season is the time to deepen those relationships -- remember their names, note their preferences, make them feel valued. They sustain you through January. If you treat them like background noise during July, do not expect them to carry you through the winter.
The shift between seasons -- peak to off-peak and back -- is where most restaurants lose money unnecessarily. The problem is timing.
Staffing down too late means three weeks of paying for capacity you do not need. Staffing up too late means two weeks of turning away guests or delivering poor service because your team is stretched thin. Both are expensive, and both are preventable with leading indicators.
Jeff Gosnear of Grotto Pizza scales from 900 to 1,600 employees seasonally across 22 locations. That is not a reactive process -- it requires months of planning, hiring pipelines, and training schedules that start well before peak arrives.
For a single-location restaurant, the scale is different but the principle is the same. If your booking data shows velocity picking up in week 2 of March, that is your signal to start training seasonal hires -- not in week 1 of April when the dining room is already slammed.
The same data works in reverse. When booking velocity starts softening in week 3 of September, you can begin reducing prep quantities, adjusting staff schedules, and shifting marketing from "book now" to "keep coming." A gradual adjustment is always cheaper than an abrupt one.
Weather is not strictly seasonal, but it modulates demand within seasons. Peer-reviewed research found that good-weather days produce 5.2% higher revenue, while bad-weather days reduce it by 2.6%. Heavy snow events can cause 35% single-day losses.
The NRA confirms the scale: over 90% of operators say weather affects their sales.
A 5-day weather forecast is accurate enough to adjust same-week staffing and prep. If Friday's forecast shows heavy rain, you can reduce your prep by 10-15% and schedule one fewer server for the evening -- not because you are guessing, but because the data says walk-in traffic drops measurably in bad weather.
Delivery can partially offset weather-driven dine-in drops, but platform commissions typically run 15-30%, which means the margin recovery is partial at best. A restaurant that does EUR 2,000 in delivery revenue on a rainy Friday at 25% commission keeps EUR 1,500 -- better than nothing, but not equivalent to the dine-in revenue it replaced.
Nine Tables tracks booking velocity, cover counts, and walk-in ratios over time -- the leading indicators that show seasonal transitions before they appear in revenue. The analytics dashboard compares current booking pace against the same period last year, highlighting whether the season is shifting earlier or later than expected.
Pre-service reports show expected covers based on reservations, historical walk-in rates, and no-show predictions. During transitions, these reports become especially valuable because they surface the gap between what your schedule assumes and what the data projects.
For a deeper look at how daily data translates into better decisions, we wrote about moving from gut feeling to dashboard-driven management.
Seasonal planning is not about surviving the slow months. It is about building a year-round business where each season serves a purpose.
Peak season generates the profit that sustains the quiet months and the guest data that fuels off-season marketing. Off-season deepens relationships with regulars, develops staff skills, and provides the low-pressure environment to test new menu items or service approaches.
Eliza Gavin, the operator with the 57% cover swing, chooses to close her restaurant entirely for part of the off-season -- not as a defeat, but as a strategy. She uses the closure for renovation, staff training, and menu development, reopening refreshed for the next peak.
Not every restaurant has that option. But every restaurant has booking data that tells them when the season is turning -- usually two to three weeks before the revenue confirms it. The question is whether you are watching the leading indicators or waiting for the P&L to tell you what already happened.